Draw History as a Tool for Lower League Football Selection Refinement
Written by Sofia Müller · Oct 11, 2026
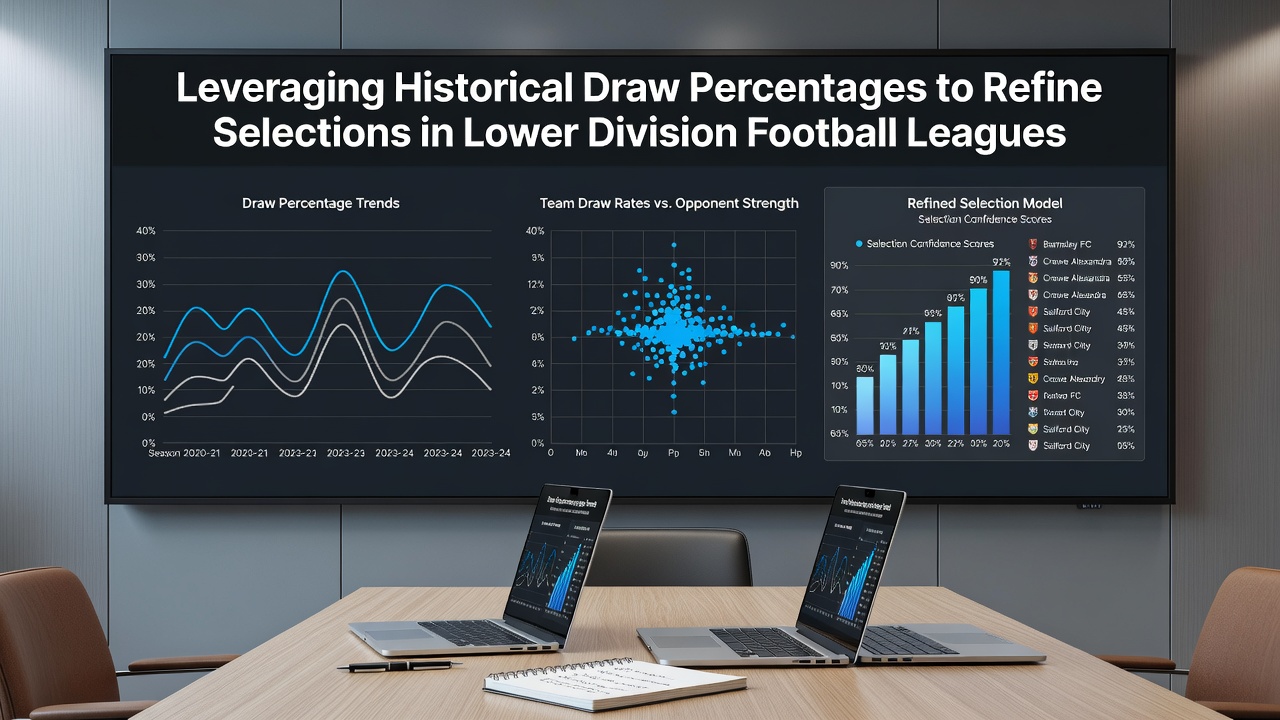
Draw History as a Tool for Lower League Football Selection Refinement
Lower division football leagues often produce draw rates that differ markedly from those recorded in top-flight competitions, and analysts track these percentages across multiple seasons to identify consistent patterns. Data compiled from leagues such as England's National League, Germany's Regionalliga, and Italy's Serie C shows draw frequencies that frequently range between 28 and 35 percent, figures that remain stable when examined over five-year windows. Observers note that teams in these divisions tend to share similar defensive structures and limited attacking resources, factors that contribute to the elevated incidence of stalemates compared with higher divisions where attacking talent creates more decisive results.
Compiling and Interpreting Historical Percentages
Researchers assemble historical draw percentages by aggregating match outcomes from official league archives and cross-referencing them with advanced metrics supplied by performance tracking firms. One study published by the University of Groningen examined 12,000 matches across six lower-tier European leagues and found that home teams recorded draw percentages of 31.4 percent when facing opponents with comparable mid-table positions in the prior campaign. These figures become actionable when filtered further by variables such as goal difference averages and recent form streaks, allowing selections to focus on fixtures where both sides have posted draw rates above 30 percent in their last twenty home or away games respectively.
Additional layers of analysis incorporate weather conditions and fixture congestion, elements that data from the Canadian Soccer Association indicates can shift draw likelihood by as much as four percentage points in lower division schedules. Teams playing their third match in eight days, for instance, demonstrate higher draw frequencies because fatigue reduces the capacity for late winning goals. Analysts therefore combine raw historical percentages with these contextual filters rather than relying on season-long averages alone.
Application Across Specific Lower Division Contexts
Leagues operating below the second tier often feature tighter budgets and fewer squad rotations, conditions that sustain the draw-prone environments captured in long-term statistics. In the 2025-2026 season, lower division schedules across several European federations continued to reflect these traits, with October 2026 fixtures showing draw percentages within two points of the five-year rolling average. Practitioners refine selections by isolating matches where both clubs have converted fewer than 35 percent of their scoring opportunities in the preceding six weeks, a threshold that correlates with elevated draw likelihood according to aggregated performance databases.
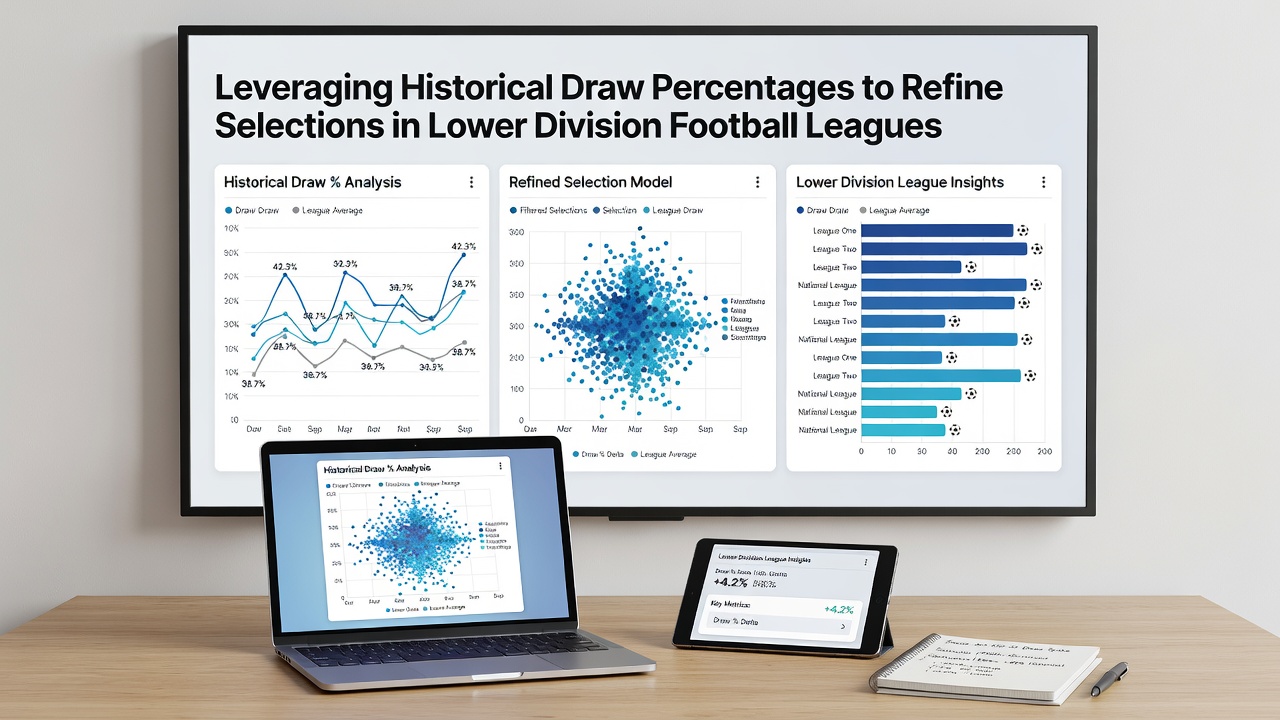
Take one dataset released by the European Club Association that tracked 4,800 lower division encounters between 2021 and 2025; the report highlighted that away sides with a historical draw percentage above 33 percent at specific venues produced stalemates in 38 percent of subsequent visits. Selectors incorporate such venue-specific history into models that also weigh referee assignments, since certain officials issue fewer cards and thereby reduce the disruptive impact of red cards on match tempo. The combination of these inputs produces narrower candidate lists than those generated by single-season statistics.
Integration with Contemporary Data Streams
Modern platforms merge historical draw percentages with real-time inputs such as expected goals differentials and set-piece conversion rates, creating composite scores that update after each round of fixtures. Figures released by the Australian Institute of Sport in mid-2026 demonstrated that models weighting the prior three seasons of draw data outperformed those using only the current campaign by a margin of 6.2 percent in predictive accuracy across 1,200 lower division matches. This edge arises because short-term variance from injuries or managerial changes tends to regress toward longer-term norms once a sufficient sample accumulates.
Practitioners also examine head-to-head records within lower division subgroups, noting that certain pairings maintain draw percentages 5 to 7 points above the league baseline even when separated by multiple seasons. These persistent relationships receive additional weight in selection processes, particularly when both clubs occupy similar positions in the current standings and share comparable goal-scoring outputs per 90 minutes.
Conclusion
Historical draw percentages supply a stable reference point for refining selections in lower division football leagues when combined with contextual variables and contemporary performance indicators. Data from multiple seasons across several federations confirms that these percentages remain consistent enough to serve as filters, yet they require integration with factors such as fixture density and venue history to maintain relevance. As leagues publish updated statistics each October, analysts continue to adjust models accordingly, preserving the utility of long-term draw trends within an evolving data environment.